


Getting traffic is only the starting point.
A page can pull in thousands of visitors and still fall short of what it was built to do. Some people leave because the content wasn't what they expected. Others leave because they got exactly what they needed — fast.
Bounce rate helps you study that behaviour. But it's also one of the most misread metrics in web analytics.
A high percentage isn't always bad. A low one doesn't guarantee the page is doing its job. It depends on the type of content, what the visitor was after, and how you define a bounce in the first place.
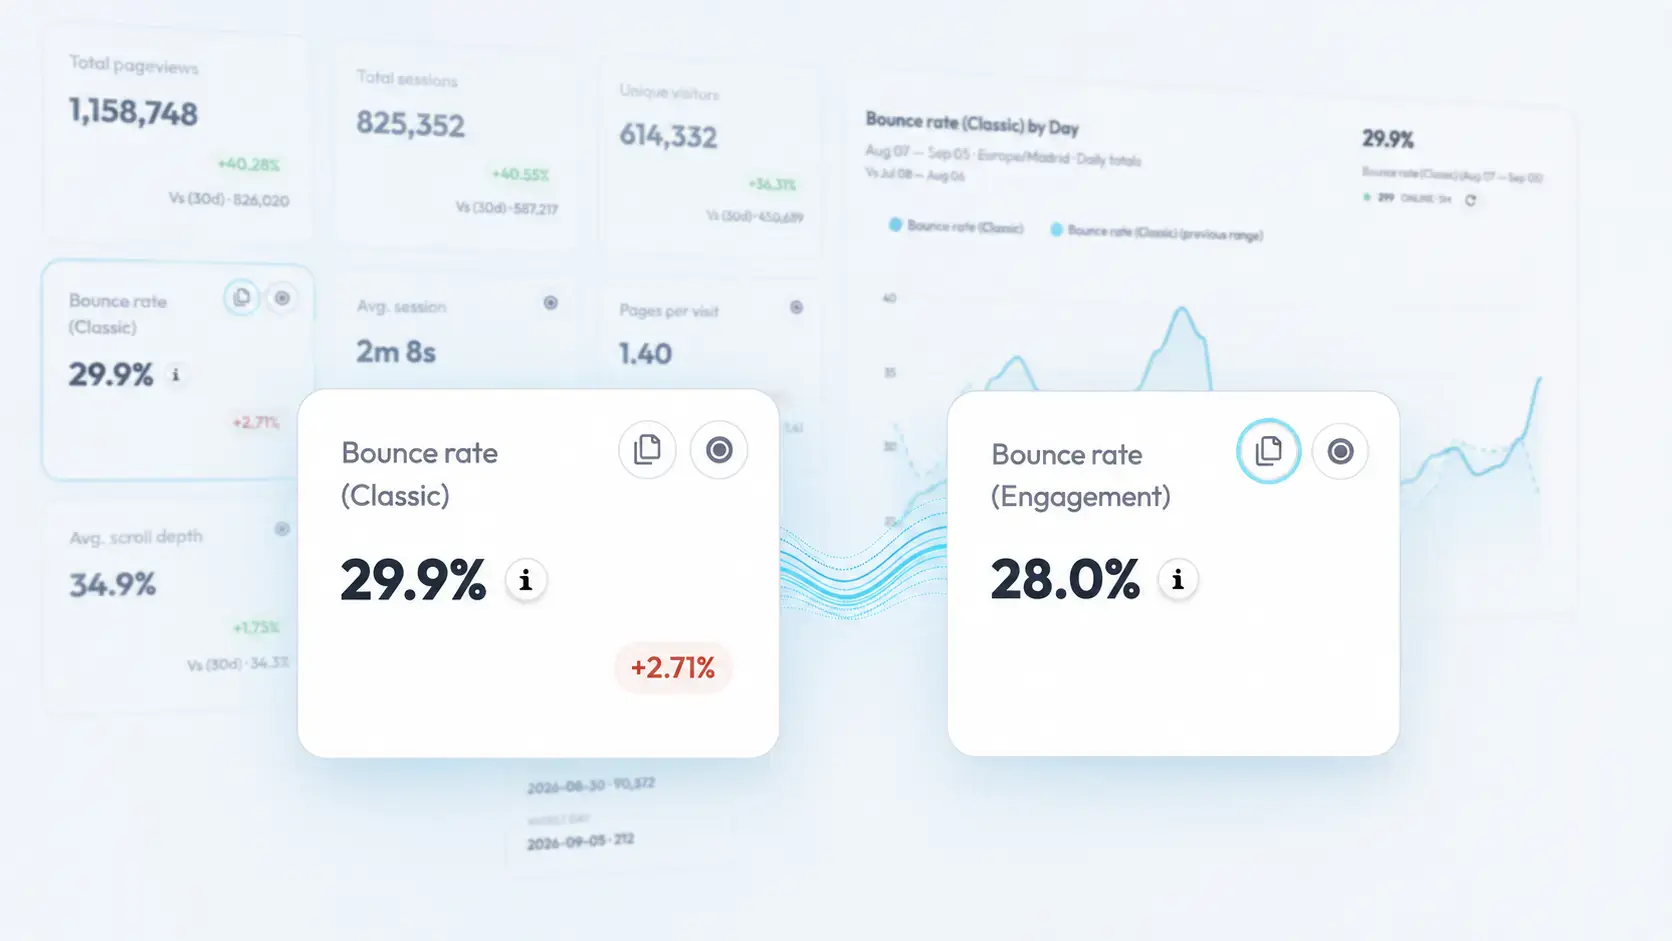
That's why Yabrix Analytics measures bounce rate in two ways: a classic model and one built around engagement.
What is bounce rate?
Bounce rate — or bounce rate, as it's commonly referred to in analytics tools — is the percentage of sessions that end without meeting certain navigation or interaction criteria.
In the traditional sense, a bounce happens when someone lands on a page and leaves without visiting another one.
But that definition falls short for blogs, news sites, documentation pages and other content that can do its job without generating a second pageview.
Someone might find an article through a search engine, read it thoroughly, and close the tab. The session included just one page. That doesn't mean the content failed.
To separate these behaviours more clearly, Yabrix Analytics lets you check two different measurements.
The two bounce rates in Yabrix Analytics
Not every site needs to read bounce rate the same way.
In an online shop, you'd expect visitors to browse products and move towards checkout. On a blog, reading a single article without opening another page can be a perfectly successful session.
Classic Bounce Rate
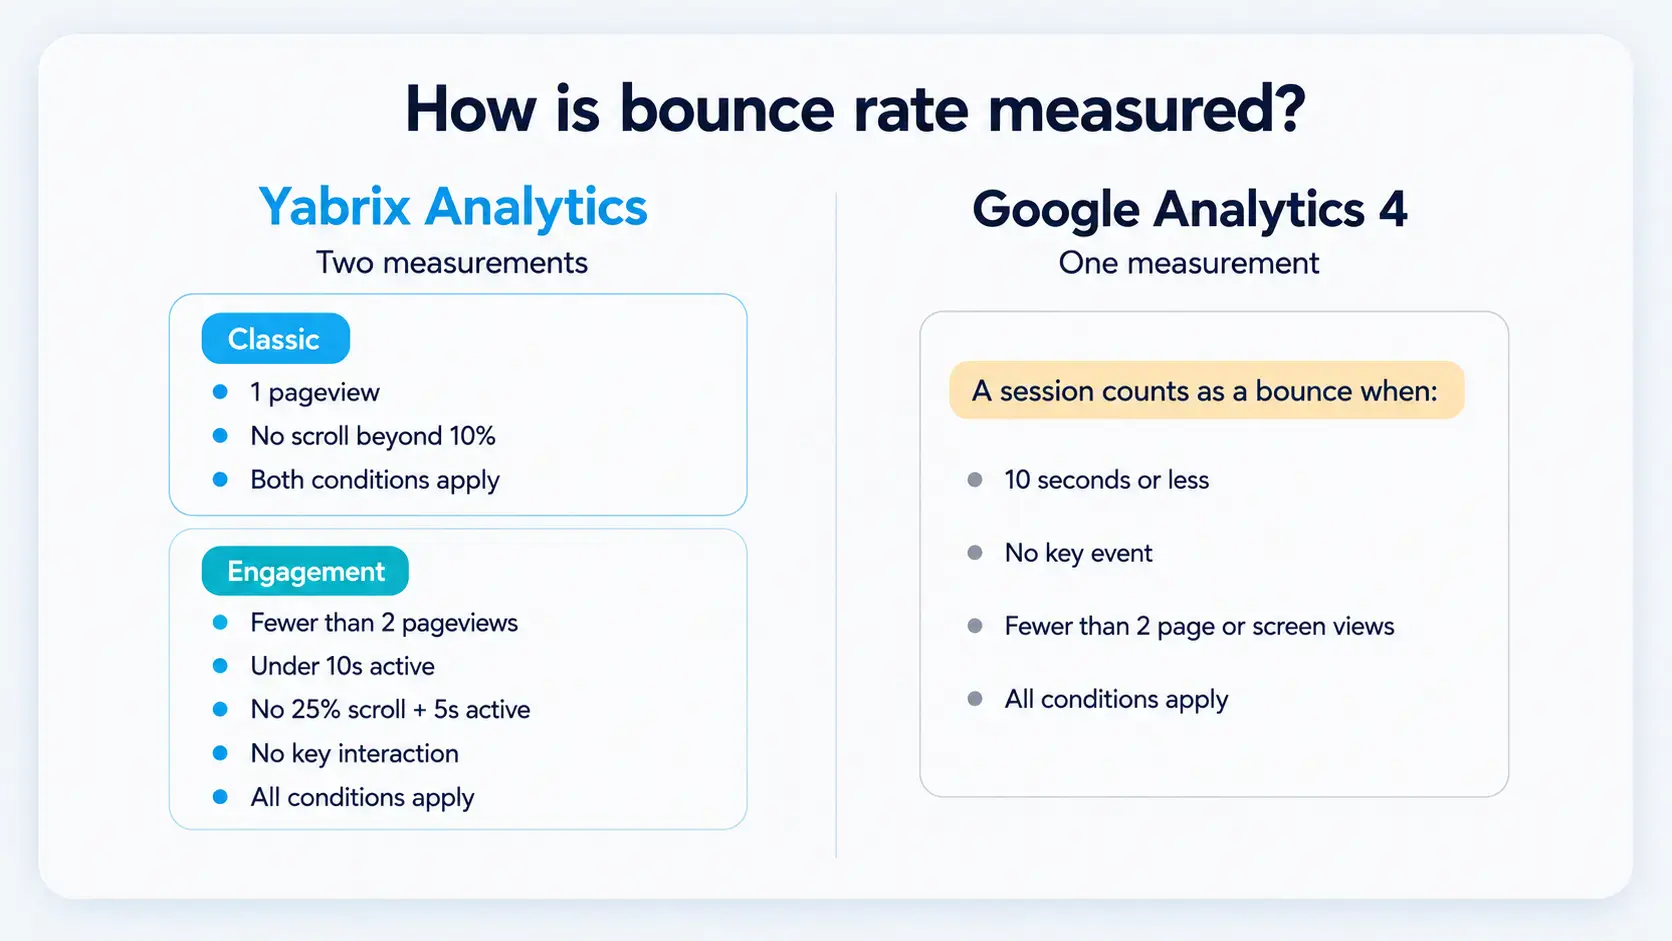
The classic bounce rate counts a session as bounced when both of these conditions are true:
- It records a single pageview.
- The visitor doesn't scroll past 10% of the page.
This picks up people who arrive, barely start consuming the content, and leave without going further.
If the visitor scrolls beyond 10%, the session is no longer treated as a classic bounce — even without a second pageview.
This measurement works well for online shops, catalogues, service portals and corporate websites, where you'd normally expect the user to visit several pages.
Engagement Bounce Rate
The engagement-based bounce rate brings in more signals to work out whether the visitor actually engaged with the content.
A session only counts as a bounce when all of these conditions are met:
- Fewer than two pageviews.
- Less than 10 seconds of activity.
- Scroll depth below 25% combined with at least 5 seconds of activity.
- No recorded interaction of note.
So if the session shows even one of those engagement signals, it's not counted as a bounce.
This gives you a more useful picture for articles, guides, documentation and landing pages that can fulfil their purpose without the user visiting another URL.
Say someone reads part of an article for 30 seconds and then leaves. They only saw one page, but their active time shows they didn't abandon it straight away.
Or someone clicks the main button on a landing page without scrolling at all. That interaction tells you the page did what it was supposed to.
Having both metrics lets you tell these behaviours apart rather than flattening them into a single number.
How does Google Analytics 4 measure bounce rate?
Google Analytics 4 uses a single definition. It calculates bounce rate as the percentage of sessions that don't qualify as engaged sessions.
For GA4, a session counts as engaged when it meets at least one of these conditions:
- Lasts longer than 10 seconds.
- Records a key event.
- Includes two or more page or screen views.
If none of those apply, it's a bounce. GA4's bounce rate is effectively the inverse of its engagement rate.
This adds more nuance than a measurement based purely on pageviews, but it applies the same criteria across all content.
Yabrix gives you two angles so you can pick the one that fits. The classic rate focuses on pageviews and initial scroll. The engagement rate also factors in active time, a deeper combination of scroll and activity, and notable interactions.
For instance, if someone spends eight seconds on an article and scrolls past 25% of the content, GA4 will count the session as a bounce if there's no second pageview or key event. Yabrix's engagement measurement will recognise that the visitor did start consuming the content.
No single method works for every scenario. What matters is knowing what behaviour each percentage represents — and sticking to the same definition when you compare results.
How is bounce rate calculated?
The general formula is straightforward:
Sessions counted as bounces ÷ Total sessions × 100
If a site gets 1,000 sessions and 420 meet the bounce criteria, the rate is 42%.
What changes between models isn't the formula — it's the definition of which sessions count as bounces.
For that reason, don't compare a classic rate directly with an engagement-based one. And don't compare figures from platforms that use different criteria without understanding how each was calculated.
Bounce rate, engagement rate and exit rate
These three metrics describe related behaviours, but they don't mean the same thing.
Bounce rate picks out sessions that ended without meeting specific criteria. Engagement rate looks at sessions where the visitor showed meaningful activity — staying active, scrolling, visiting another page or completing an action.
Exit rate tells you how often a particular page was the last one in a session, regardless of what the user did beforehand.
Picture this journey:
Homepage → Product → Pricing → Exit
The pricing page records an exit, but not a bounce, because the visitor had already navigated through other pages.
A high exit rate can be perfectly normal on a confirmation page. On a step in the checkout flow before purchase, it might point to a problem.
What counts as a good bounce rate?
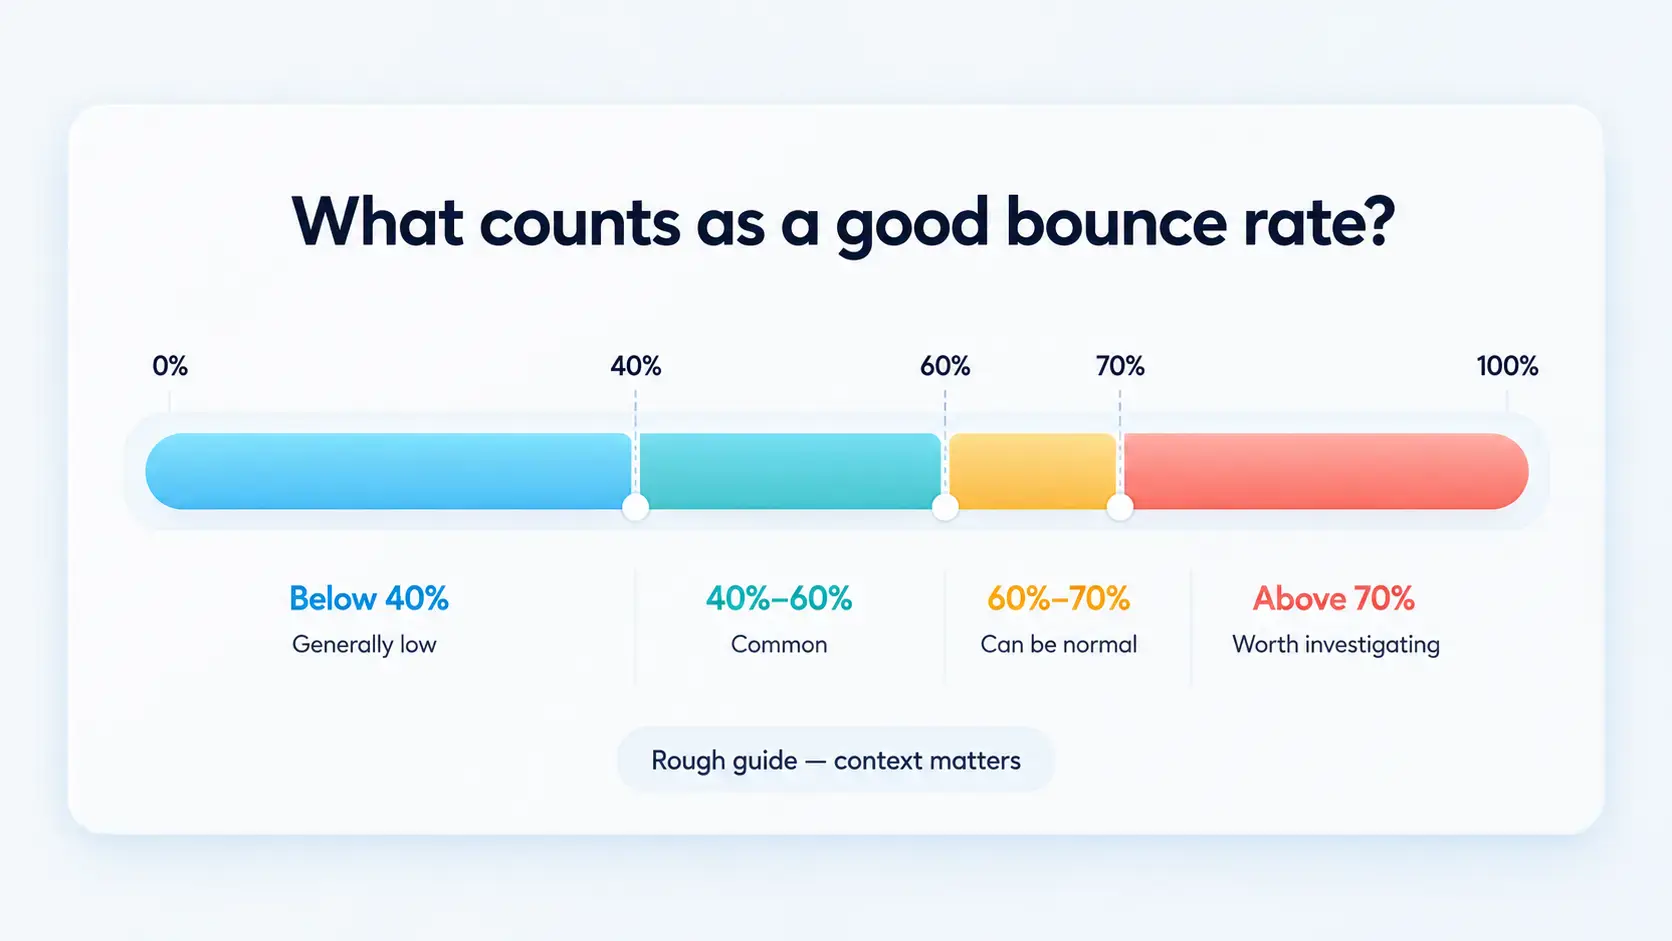
There's no universally good bounce rate. As a rough guide:
- Below 40% is generally considered low.
- Between 40% and 60% is common across many sites.
- Between 60% and 70% can be normal depending on the content.
- Above 70% is worth investigating.
Don't treat these as targets.
The same site might show a relatively high classic rate and a much lower engagement rate because visitors read or interact without opening other pages.
A high rate might be worrying on a product page designed to push users towards purchase. On an informational article, it might simply mean the visitor found what they were looking for.
The best benchmark is usually the trend across your own pages — comparing content with similar goals and always using the same measurement method.
How to read bounce rate properly
The site-wide average can hide more than it shows. To get anything useful from it, you need context.
Compare similar pages
There's little point comparing an informational article with a pricing page. Group pages that share the same function and goal.
Compare both measurements
A high classic rate paired with a lower engagement rate may tell you that visitors are consuming the content but not navigating further.
For an article, that's often fine. For a page designed to send users towards a product or form, it could mean there's no clear next step.
Segment by source and device
Visitors arriving from search engines, newsletters, paid ads or AI assistants can behave very differently.
A high rate concentrated in one source might mean the messaging on that channel doesn't match what's on the page.
Differences between desktop and mobile can also flag issues with speed, readability or usability.
Use other metrics alongside it
Bounce rate is most useful when you look at it together with:
- Average session duration
- Pages per visit
- Scroll depth
- Notable interactions
- Conversions
- Traffic sources
- Navigation paths
Someone who leaves after three seconds is not behaving the same way as someone who reads for several minutes. These metrics help you tell them apart.
How to bring bounce rate down
Lowering it shouldn't be a standalone goal. The real aim is to make the experience better and help the visitor take the right action.
Match the visitor's intent
The introduction should confirm quickly that the person has landed in the right place. The content needs to deliver on the promise made by the search result, the ad or the link that brought them there.
Speed up the page and fix the mobile experience
A slow page or one that's awkward to use on a phone can lose the visitor before they even assess the content. Pay particular attention to your highest-traffic pages and how they perform on mobile.
Make it easy to read
Short paragraphs, descriptive subheadings, a clear hierarchy. Content that's hard to scan can drive people away even when the information itself is good.
Give them somewhere to go next
Internal links, related content and calls to action help continue the journey.
That next step should fit the visitor's intent. A reader learning about a metric will probably respond better to related content than to a hard sales pitch.
Check your traffic and your tracking
A campaign can bring in plenty of visits without necessarily attracting the right audience. Segment by source to spot irrelevant traffic.
A surprisingly high or low rate can also come down to duplicate pageviews, misconfigured interactions, or actions that aren't being tracked properly.
Bounce rate needs context
Bounce rate tells you how many sessions ended without meeting certain criteria. On its own, it doesn't explain why — or whether the visitor got what they came for.
That's why Yabrix Analytics gives you both a classic measurement and an engagement-based one. Looking at both lets you tell the difference between a visit that ended after delivering value and an experience that genuinely needs work.
Yabrix Analytics brings these measurements together with session duration, pages per visit, scroll depth, traffic sources and navigation paths.