Most analytics tools still revolve around general traffic figures. Visits, sessions, page views, average duration — they're fine for a quick snapshot, but they rarely answer the question that actually matters: what do users do once they land on your site? If you're not sure what engagement rate is, read this article.
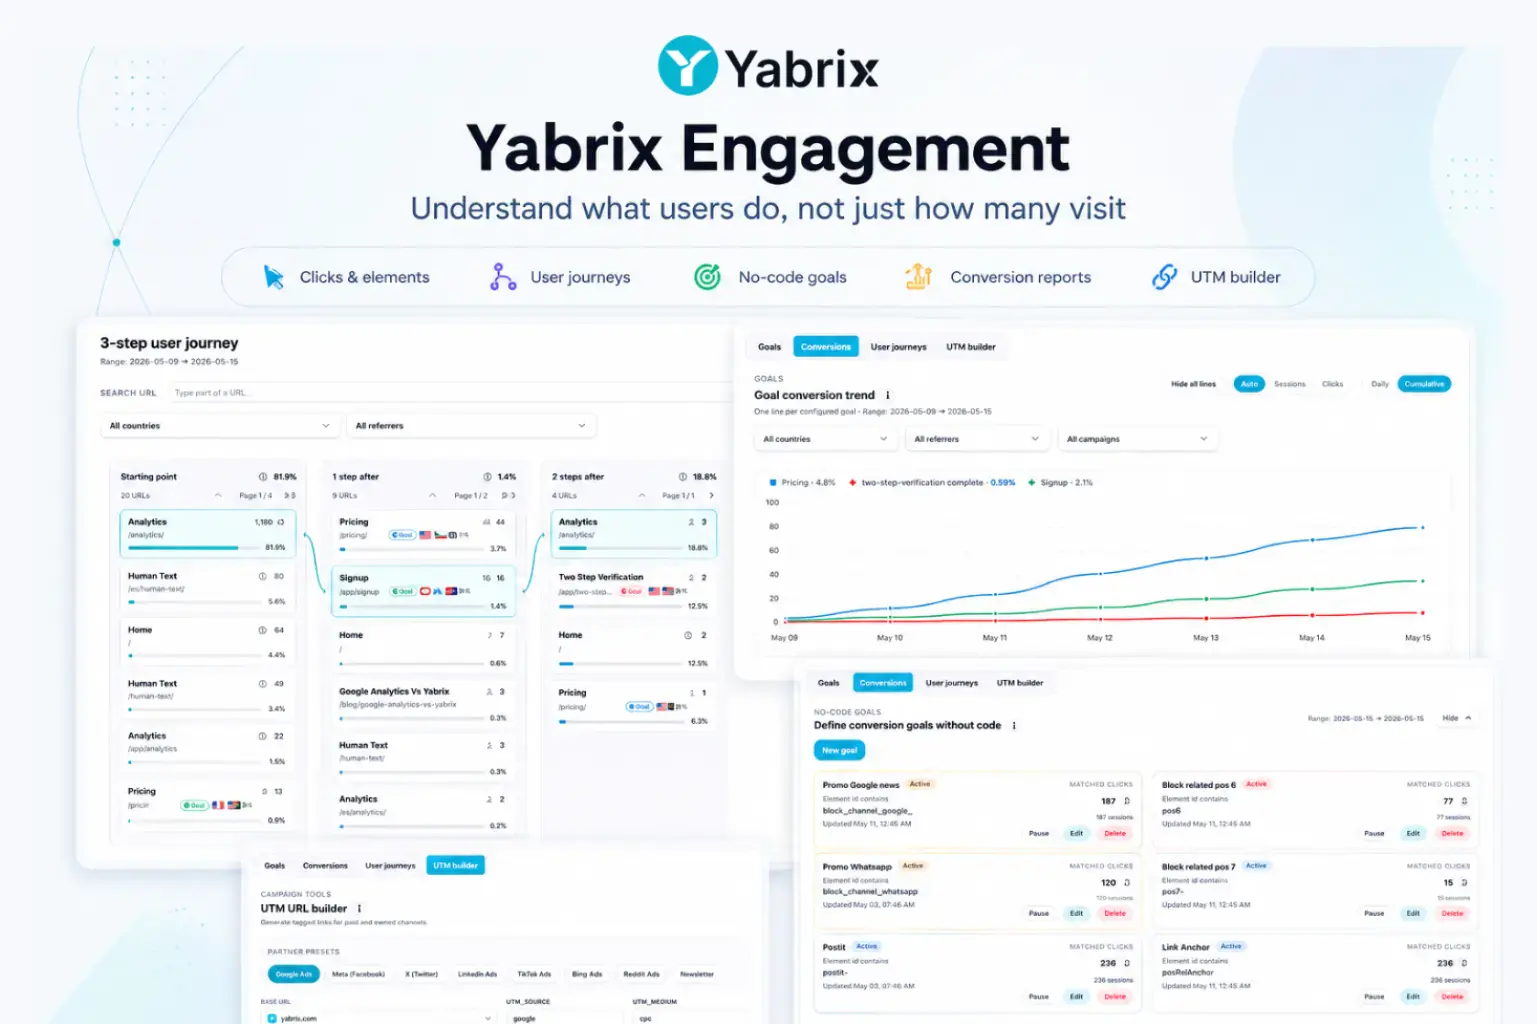
Yabrix Engagement was built to fill that gap. Rather than simply counting traffic, the system tracks real interaction like clicks, navigation paths, behavioural patterns and conversions — all presented in a visual, practical layout that doesn't bury you in endless menus. The point isn't just knowing how many people reach a page. It's understanding which content gets them moving, which elements trigger action, and which journeys end up producing something worthwhile.
All of this sits within a single section. No jumping between scattered menus for user journeys, events, conversions and campaigns. One place, one view.
Why traffic volume alone tells you very little
A page can rack up thousands of visits and still generate almost no interaction. The opposite happens too: URLs with modest traffic sometimes turn out to be critical pieces in a site's navigation because they funnel users towards pricing pages, sign-up forms or specific modules.
That's why Engagement focuses on the quality of behaviour, not just volume.
The section surfaces patterns that typically stay hidden inside traditional analytics. Which internal links actually get attention. Which blocks go unnoticed. Which promotional modules generate clicks. Which pieces of content act as a bridge towards pages like pricing, registration or contact forms.
For editorial projects and digital publishers, this kind of detail is particularly useful — it shows which articles keep users browsing and which ones serve only as dead-end landing pages with no follow-on navigation.
For transactional projects, it can shift how you spend money. Which campaigns convert and which ones drain budget. What path users follow before converting. Which countries interact and which don't. All of this feeds back into decisions based on real user behaviour. And it happens in real time.
Click engagement by URL
One of the main blocks inside Engagement is Click Engagement by URL — a view that ranks pages by the interaction they generate, not just by visit count.
The tool quickly flags which URLs produce the most activity on the site. Instead of stopping at session numbers, Yabrix shows which pages receive clicks, lead to further navigation, or act as stepping stones towards other content.
This uncovers behaviour that traditional tools tend to miss. Articles generating heavy internal interaction despite not being the most visited. Homepages that barely distribute traffic at all. Content that works unusually well as a gateway to conversion areas.
The view also ties into other interaction and navigation metrics, making it easier to read user behaviour in a fuller picture. See all features.
Most clicked elements
Another highly visual section within Engagement is Most Clicked Elements, which identifies exactly which components on a page receive the most interaction.
Here, the analysis moves beyond URL level and drills into specific interface components — links, buttons, internal promotions, related-content modules, anchors, highlighted blocks.
For publishers, this is especially telling. A related-articles block might generate hundreds of clicks while another one, placed in what looks like a stronger position, barely registers. A particular CTA might outperform everything else on the page despite having less initial visibility.
This data feeds directly into more precise decisions about internal site structure, module placement and content layout.

User journeys and path analysis
The User Journeys feature lets you see how users actually move between pages on your site.
Rather than looking at each URL in isolation, the system maps navigation paths to show what routes visitors typically take before and after reaching a given page. This makes it possible to spot recurring behaviour, frequent conversion routes, or points where traffic drops off.
A page might pull in strong search traffic but produce almost no onward navigation. Another might quietly become a regular stop before sign-up or purchase. You can also see which content bridges different sections of the site, or which routes are most common among users who end up converting.
The visualisation is designed to be quick to read, even on sites with high navigation volume.
Code-Free goals
Engagement also includes a code-free goal system.
The idea is straightforward: strip away the technical overhead of tracking conversions. No custom event implementations, no manual configurations. From the panel itself, you can set up goals based on specific page elements, URL patterns, or partial matches tied to clicks and interaction.
This means you can measure very specific actions almost immediately. Clicks on internal promotions, sign-up buttons, related-content modules, house banners, or highlighted links within articles.
It's particularly suited to editorial teams, SaaS projects, or any site where you need to create and adjust conversion tracking quickly — without waiting on dev changes.

Conversion reports
The conversion reporting layer rounds out the Engagement toolkit by showing how your configured goals perform over time.
Reports break down which campaigns, traffic sources or user journeys produce the strongest results, giving you a much clearer read on what each channel actually delivers. Instead of stopping at traffic received, the system highlights which sessions end up producing meaningful actions.
Integration with campaigns, referrers and internal navigation lets you cross-reference behaviour and interaction data — something that proves especially useful when reviewing acquisition strategies, internal promotions or content-led campaigns.
Built-In UTM URL builder
Yabrix also includes a UTM URL builder designed to simplify tagged campaign creation.
From the panel, you can generate links ready for Google Ads, Meta, X, LinkedIn, TikTok, Bing or newsletters — no need for external tools. Those campaigns can then be analysed directly within the Engagement and conversion reports.
It might seem like a small addition, but having it inside the same environment makes follow-up tracking considerably smoother. It also cuts down on the naming inconsistencies and parameter errors that tend to creep in when teams use separate tools.
Analytics built around real behaviour
The thinking behind Engagement is simple. Knowing how many users reach a page is no longer enough on its own.
What matters is understanding how they interact, which elements they use, which content drives further navigation, and which journeys lead to actual results.
Yabrix brings interaction, navigation, campaigns and conversions together in a single section — built to deliver actionable information quickly, visually, and without unnecessary friction.